| New Apps Now Available! |
|
Apps are a new feature in Origin 2016, allowing you to extend the capabilities of Origin. We published five new Apps in January:
View all available Apps by visiting our File Exchange page.To watch App tutorial videos, visit our YouTube Channel. |


|
| ||
|
| Upcoming Events |
|
Pittcon 2016 Mar 7-10, 2016 Booth #1946 APS 2016 Mar 15-17 Booth #611 AIChE 2016 Apr 10-13, 2016 Booth TBD Neuroscience 2016 Nov 13-16 Booth #1536 |
| Contact with OriginLab |
|
Stay in Touch with OriginLab and other users:
Send your comments and suggestions to: For more information about OriginLab, visit: Mailing Address: OriginLab Corporation |


| Tech Tips |
|
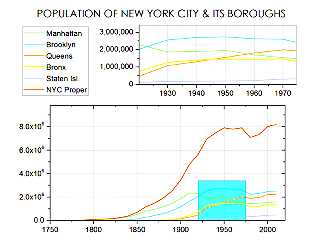
Making Dynamic Inset Graphs Origin provides users with a number of ways to generate inset graphs for sections of their data. This blog post will show you three ways to accomplish this using templates, enlarged graphs, and by manually adding layers to existing plotted data.
|
|
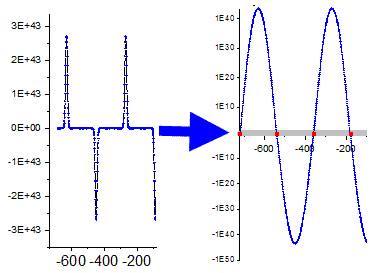
Visualizing the Negative Log The logarithm of a negative value is not defined in the read space, but in practical applications, we occasionally see that the magnitude of the data changes exponentially even in the negative area. This blog will show you how to present such data in a graph.
|